
eth_getLogs is the Ethereum JSON-RPC method that returns every event log matching a filter you supply — a contract address, a block range, and a set of topics. It’s the standard way to pull historical crypto logs after the fact: the token transfers, swaps, and state changes a contract recorded while it ran. Point it at the right filter and you can rebuild most of an address’s on-chain activity without replaying a single block of execution.
This guide covers what those logs are, why they exist as a separate data type, who pulls them, and how to query them correctly once your filter reaches past a handful of blocks. The mechanics are standard across every provider; the limits around them are not.
What Is an Event Log on Ethereum?
An event log is a record a smart contract writes during execution to mark that something happened, stored on the transaction’s receipt rather than in the contract’s own storage. When a Solidity contract runs emit Transfer(from, to, amount), the Ethereum Virtual Machine appends a log entry to that transaction — cheap to write, and permanent, but something the contract itself can never read back.
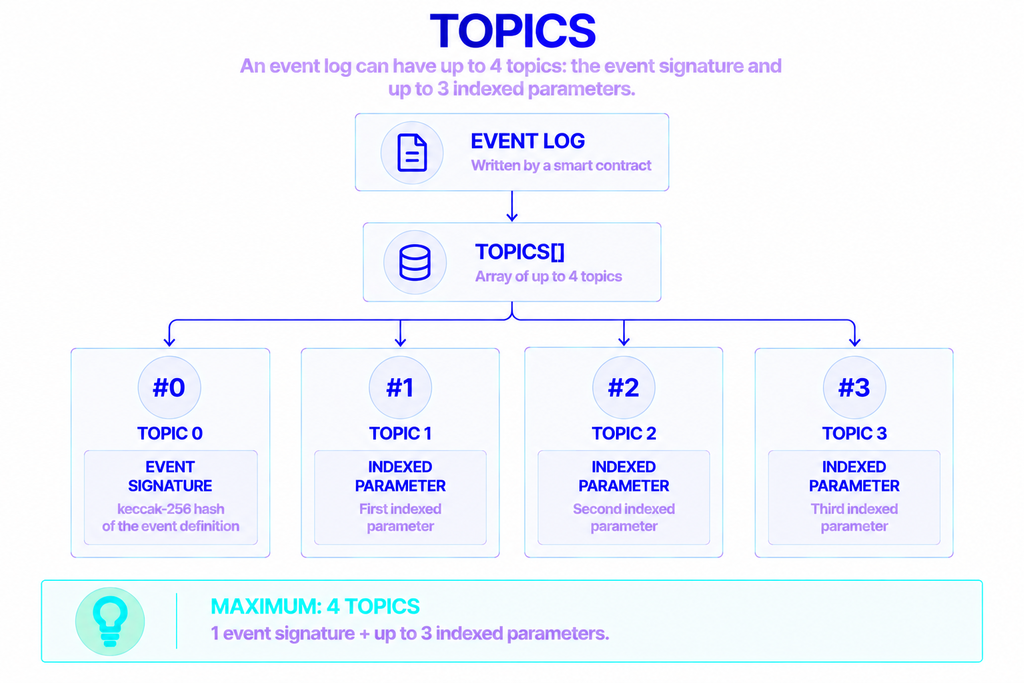
Each log splits its information into two places. Indexed parameters go into an array called topics, which the node can filter on directly. Everything else gets packed into a data field as raw hex that you decode later using the contract’s ABI.
The split matters because only topics is searchable. A log holds up to four topics: the first slot is reserved for the keccak-256 hash of the event’s signature, which leaves three slots for parameters a contract marks as indexed. That ceiling is why filtering is fast but limited — you can narrow a query to an event type and a few indexed values, and nothing more.
Why Query Logs Instead of Reading Contract State?
Logs are the only affordable way to see what a contract did over time, rather than only what it holds right now. Contract state answers “what is this balance”; logs answer “every transfer that produced it.” Re-deriving that history by replaying past transactions would mean re-executing the chain, which no application can do on each request.
Events exist to sidestep that. A decentralized exchange doesn’t keep a list of every trade in storage — it emits a Swap event per trade and lets anyone reconstruct the record from logs. An ERC-20 token works the same way: the contract tracks balances, but the Transfer event is the audit trail, and wallets and explorers collect it themselves.
There’s also a cost reason the design holds. Writing a value to contract storage is one of the more expensive operations on Ethereum, while a log entry is far cheaper, as the ethereum.org gas documentation lays out. Logs were built as a write-only, low-cost record — which is exactly what makes a method like eth_getLogs possible.
Who Relies on Event Log Data?
Different teams pull the same logs for different reasons, and most of them care about history rather than live state:
- Wallets and portfolio trackers read
Transferlogs to detect incoming tokens and rebuild an address’s history. - Block explorers decode logs into the human-readable activity feed shown under each transaction.
- Analytics dashboards aggregate
Swap,Mint, andBurnevents to compute volume and liquidity over time. - Exchanges and payment processors watch deposit-address transfers to credit accounts without scanning every block by hand.
- Security and compliance teams monitor specific events — a large withdrawal, an ownership change — to flag unusual activity.
None of them want to run execution against the whole chain. They want a filtered, decoded slice of the past, and eth_getLogs is what delivers it.
How to Query Event Logs: Parameters and a Sample Request
A query is a single filter object passed to the method, and the node returns every log that matches. The fields are all optional, but the useful ones narrow the search enough to return in time.
The Filter Object Fields
Five fields shape a query, confirmed against the ethereum.org JSON-RPC specification:
fromBlockandtoBlock— the range to search, as hex block numbers or tags like"latest". Both default to"latest".address— one contract address, or a list, to restrict which emitter’s logs you get.topics— the ordered filter on indexed values (covered below).blockHash— a single block to search, added by EIP-234. It can’t be combined withfromBlockortoBlock; you use one approach or the other.
Here’s a request that pulls every ERC-20 Transfer log sent to one address over a block range — the first step in reconstructing what that address received:
json
{
  "jsonrpc": "2.0",
  "id": 1,
  "method": "eth_getLogs",
  "params": [{
    "fromBlock": "0x13C6800",
    "toBlock": "0x13C6B58",
    "topics": [
      "0xddf252ad1be2c89b69c2b068fc378daa952ba7f163c4a11628f55a4df523b3ef",
      null,
      "0x000000000000000000000000742d35cc6634c0532925a3b844bc454e4438f44e"
    ]
  }]
}
How Topic Filtering Works
Topics are matched by position, so order is everything. The first entry is the event signature hash — keccak256("Transfer(address,address,uint256)") in the example above. A null in any slot means “match anything here,” which is why the request leaves the sender position open and pins only the recipient in topics[2].
Two rules make topic filters more flexible than they first look. A nested array acts as an OR: [[A, B]] matches a log whose first topic is either A or B. And an indexed address has to be left-padded to a full 32 bytes to line up with the topic slot, which is why the recipient above carries all those leading zeros.
One trap sits inside this. Marking a dynamic type — a string, bytes, or array — as indexed does not store the value in topics; it stores the keccak-256 hash of it instead. You can match that hash exactly, but you can never recover the original text from the topic alone.
Reading the Response
Each log in the result carries the fields you need to trace it: blockNumber, transactionHash, logIndex, the emitting address, the topics array, and the data blob. The indexed values are already readable in topics; the rest stays hex until you run it through an ABI decoder such as viem’s decodeEventLog or ethers.js’s Interface.parseLog. An empty result means no log matched your filter in that range — not that the query failed.
Rebuilding an Address’s Transaction History from Logs
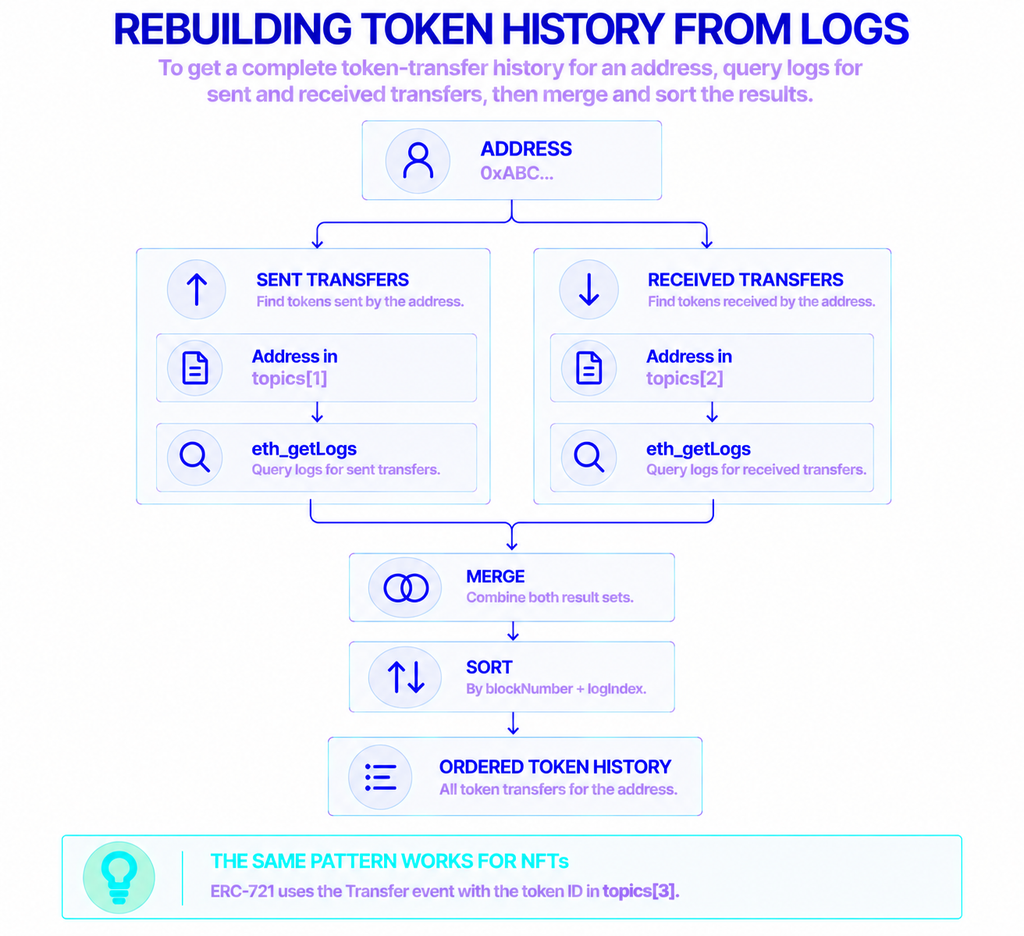
To reconstruct what an address has done with tokens, you run two Transfer queries over the same range: one with the address in topics[1] (tokens it sent) and one with it in topics[2] (tokens it received). Merge the two result sets, sort by blockNumber and logIndex, and you have an ordered token-transfer history for that account across every ERC-20 that follows the standard.
The same pattern extends to NFTs. ERC-721 emits a Transfer event with the token ID as a third indexed parameter, so the recipient filter still works — you just read the ID from topics[3] instead of an amount from data.
There’s a real limit worth stating plainly. A plain ETH transfer — sending value from one account to another with no contract call — emits no log at all, so eth_getLogs will never show it. The method sees contract events, not raw value movement. For a complete picture that includes native ETH, you need trace methods such as debug_traceTransaction, or an indexing service that stitches both sources together. Treat log-based history as “everything the token contracts recorded,” not “every transaction this address ever made.”
Provider Limits You’ll Hit (and How to Work Around Them)
This is where most queries break, because every provider caps eth_getLogs differently and none of it is standardized. Leave the filter too wide and the node has to scan an enormous span of blocks for matches. Alchemy’s own documentation warns that the method has “extreme vulnerabilities that can have huge consequences if you don’t use it correctly,” which is why the caps exist in the first place.
The numbers themselves vary by service:
| Provider / endpoint | Current limit |
|---|---|
| Alchemy | 10,000 logs per response over any range, or a 2,000-block range with a 150 MB response cap |
| Infura (MetaMask Developer) | 10,000 results per query, and a 10-second query timeout |
| QuickNode | 10,000 blocks per request by default |
| Free public endpoints | Vary widely, often 50–1,000 blocks per query |
The Alchemy figures come from its deep dive on the method; Infura’s 10,000-result cap and timeout are stated in the MetaMask Developer docs, which return error -32005 when either is exceeded; QuickNode documents its 10,000-block range limit separately. The lesson is to check your endpoint’s specific caps before you design a query, not after it starts failing.
Why Pagination Is Non-Negotiable
Any query reaching across months or years will exceed one of those caps, so wide historical pulls have to be split. Divide the full range into chunks that fit under whichever limit your endpoint enforces, request them in sequence, and stitch the results together.
Two details decide whether this works. First, old data lives only on archive infrastructure — a pruned node discards historical state, so filters that reach far back need an archive-enabled endpoint. Second, a query that fails because it hit a cap returns an error naming the limit; the fix is a smaller range, never a retry of the same one.
Filters vs One-Shot Queries
eth_getLogs is a one-shot request: you send a full filter object and get the matching logs back in that single call. Ethereum also offers a stateful alternative — eth_newFilter installs a filter on the node and returns an ID, then eth_getFilterChanges returns only the new logs since your last poll, and eth_getFilterLogs returns all logs for that filter. It suits repeated polling for the same criteria, but installed filters time out if you stop polling them, as the JSON-RPC spec notes, so they aren’t reliable for long gaps.
| Approach | Best for | Catch |
|---|---|---|
eth_getLogs | A known range you query once | You handle pagination yourself |
eth_newFilter + eth_getFilterChanges | Repeated polling for the same filter | The filter expires if left unpolled |
eth_subscribe (WebSocket) | Live logs as blocks arrive | No historical backfill on its own |
Where to Run High-Volume Log Queries
Once log queries move from an occasional script into continuous monitoring, the constraint stops being the filter and becomes how much request volume and history your endpoint can sustain. NOWNodes’ Ethereum endpoint exposes eth_getLogs alongside archive access on the same network, so a historical backfill and a recent query run against one place instead of two.
For anything that needs logs the moment they land — a bot reacting to a specific event, a dashboard updating live — NOWNodes’ WebSocket API handles the eth_subscribe side that eth_getLogs can’t, pushing matches over one open connection rather than a polling loop. And for workloads that run heavy query volume around the clock, such as an indexer rebuilding a protocol’s full history, a dedicated endpoint removes the shared request quota so throughput depends on allocated hardware instead of a fixed call count. If you’re only prototyping, the free public endpoints work too, though their 5-requests-per-second ceiling will throttle any serious backfill.
Conclusion
eth_getLogs turns Ethereum’s cheap, write-only event logs into a queryable history — token transfers, swaps, and contract activity you can filter by address, block range, and topic. The query mechanics are identical everywhere: a filter object, an ordered topics array, and a response you decode with an ABI. What changes between providers is the caps, so the real work is matching your block range and pagination to the endpoint you’re actually using. Get the filter right and respect the limits, and logs give you exactly what they were designed for — a complete record of what happened, without ever touching contract state.
FAQ
Does eth_getLogs return pending or unconfirmed logs?
No. The method reads logs from blocks that have already been mined, so a transaction still sitting in the mempool produces nothing. To catch events the moment they are included, use an eth_subscribe WebSocket subscription instead of polling.
How do block reorganizations affect the logs I get back?
Logs near the chain head can change if those blocks are reorganized out, since the transactions that emitted them may land in a different order or drop entirely. Querying a range that ends a few blocks behind "latest" avoids reading logs that a reorg might later invalidate.
Why did my query return an empty array instead of an error?
An empty array means the request succeeded and simply found no logs matching your filter in that range — a valid, common result. An error, by contrast, means something was rejected, such as exceeding a result or block-range cap. The two are not interchangeable, so handle them separately in code.
Can I filter logs by the transaction’s sender address?
Not directly. The method filters on a log’s topics and emitting address, not on the from field of the transaction that produced it. A sender address is only filterable if the event itself marked it as an indexed parameter, in which case it occupies a topic slot you can match.
Is eth_getLogs behavior the same across every provider?
The request format and response shape are standard, but the enforced limits are not. Result caps, block-range ceilings, query timeouts, and how far back archive data reaches all differ by provider and plan, so a query that runs fine on one endpoint can fail on another without any change to the filter.